Disclaimer: THIS IS NOT A MEDICAL RESEARCH. The article below is a data science project intended for educational purposes only.
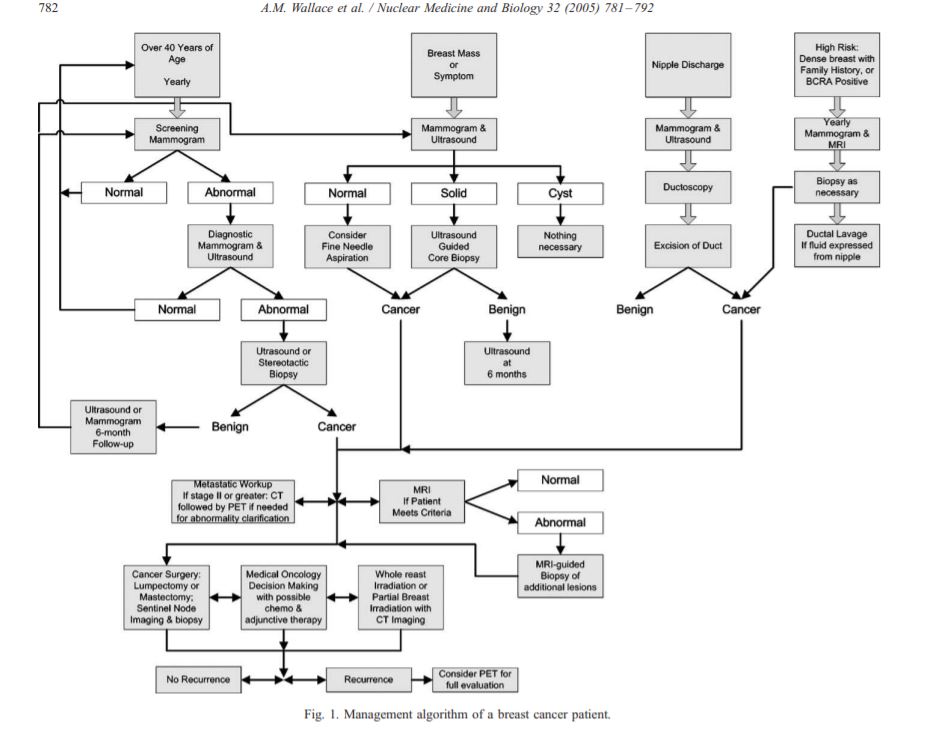
Many diagnostic pathways in medicine resemble decision trees in the machine learning field. Doctors follow a sequence of steps to accurately diagnose their patients and most of the time the medical community has established the standard protocols regarding these steps.
Generally, after accounting for the cost, availability and invasiveness, doctors select tests based on their accuracy. When we talk about preventive screenings, it is common to select tests with high sensitivity at the expense of their specificity . While doing so means distress for people diagnosed as false-positive, it also ensures that the maximum number of true-positive cases get identified.
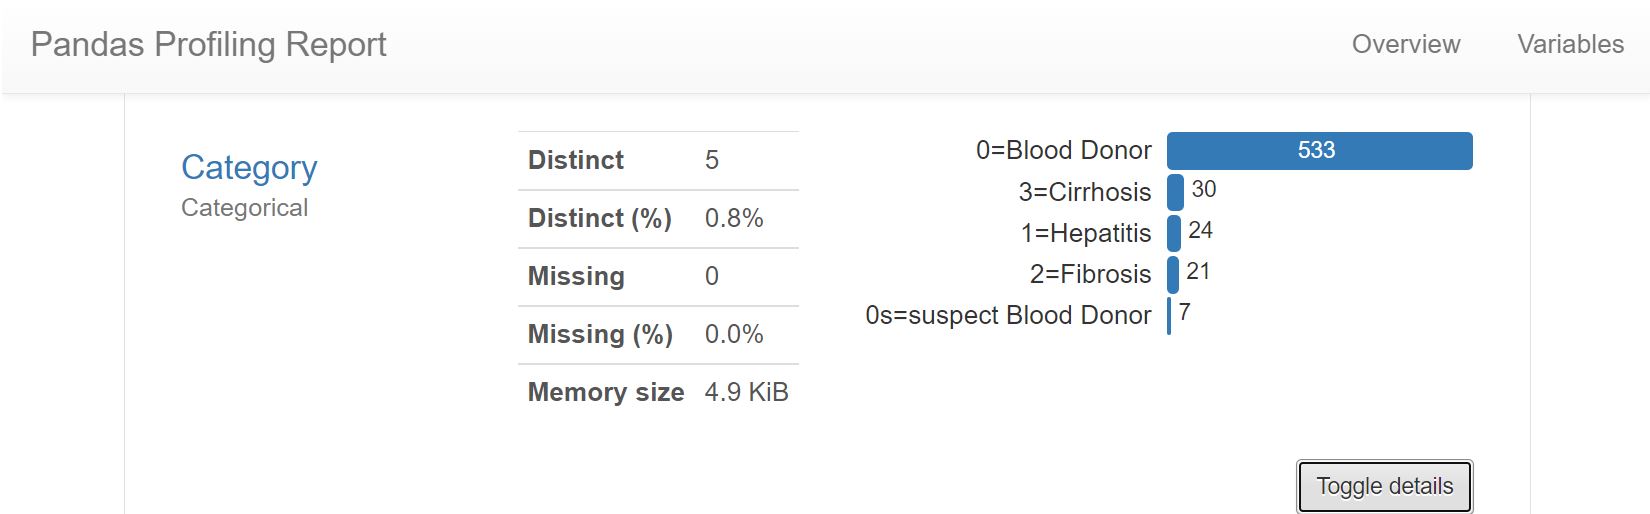
Today we will be looking at the data set containing blood work results and demographic information for hepatitis C patients. The data set is labelled and comprised of five classes, the hepatitis patients are grouped by three progressive stages of liver damage induced by the disease, healthy blood donors represent one more class, while the last class includes a small number of people whose diagnosis could be neither confirmed nor rejected based on their blood samples.
The data set was donated to UCI machine learning by the authors of the research paper Using machine learning techniques to generate laboratory diagnostic pathways—a case study. In the study, the researchers used R to create a decision tree model classifying early hepatitis, fibrosis and cirrhosis. The majority class of our data set (healthy subjects) was not included in the study. The original data set also contained three additional features - HA, PIIINP and TIMP1 markers, which were used to engineer the fourth feature, the ELF score. The Enhanced Liver Fibrosis score significantly improved the models, however, the data used to establish it was provided by Siemens and could not be included in the data set donated to UCI for legal reasons. The researchers built their models as a proof of concept rather than a diagnostic tool. Nonetheless, the decision tree algorithms were quite efficient in their accuracy:
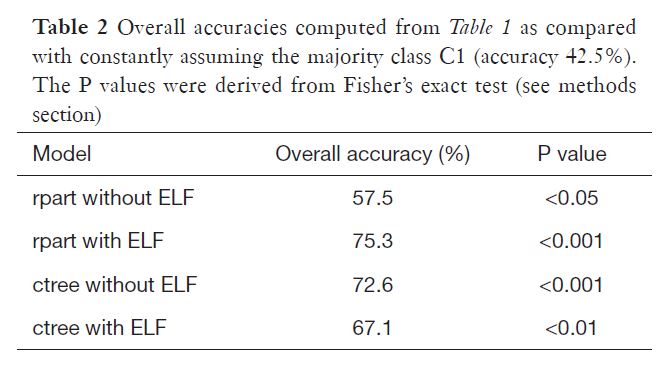
It should be once again noted that the main objective of the abovementioned research was differentiating between the classes of liver fibrosis in people with confirmed hepatitis C. In our project, we start with a data set that contains an overwhelming majority class of healthy blood donors.
A more detailed workflow description and the code I used can be found here (Google collab notebook).
Even with stratified splitting, training the models on the data set 'as is', return atrocious accuracy scores. Somehow, we need to address the majority class problem.
The data set comes rather tidy, there are only 30 NaN values which can be imputed with means. There are no extreme outliers, all maximal values reflect liver damage. However, we remove 7 observations making up the class [0s=suspect Blood Donor]. The class is too small and since it represents the group of people whose diagnosis could be neither confirmed nor rejected, it is unclear how these blood sample metrics relate to physical truth about the liver conditions.
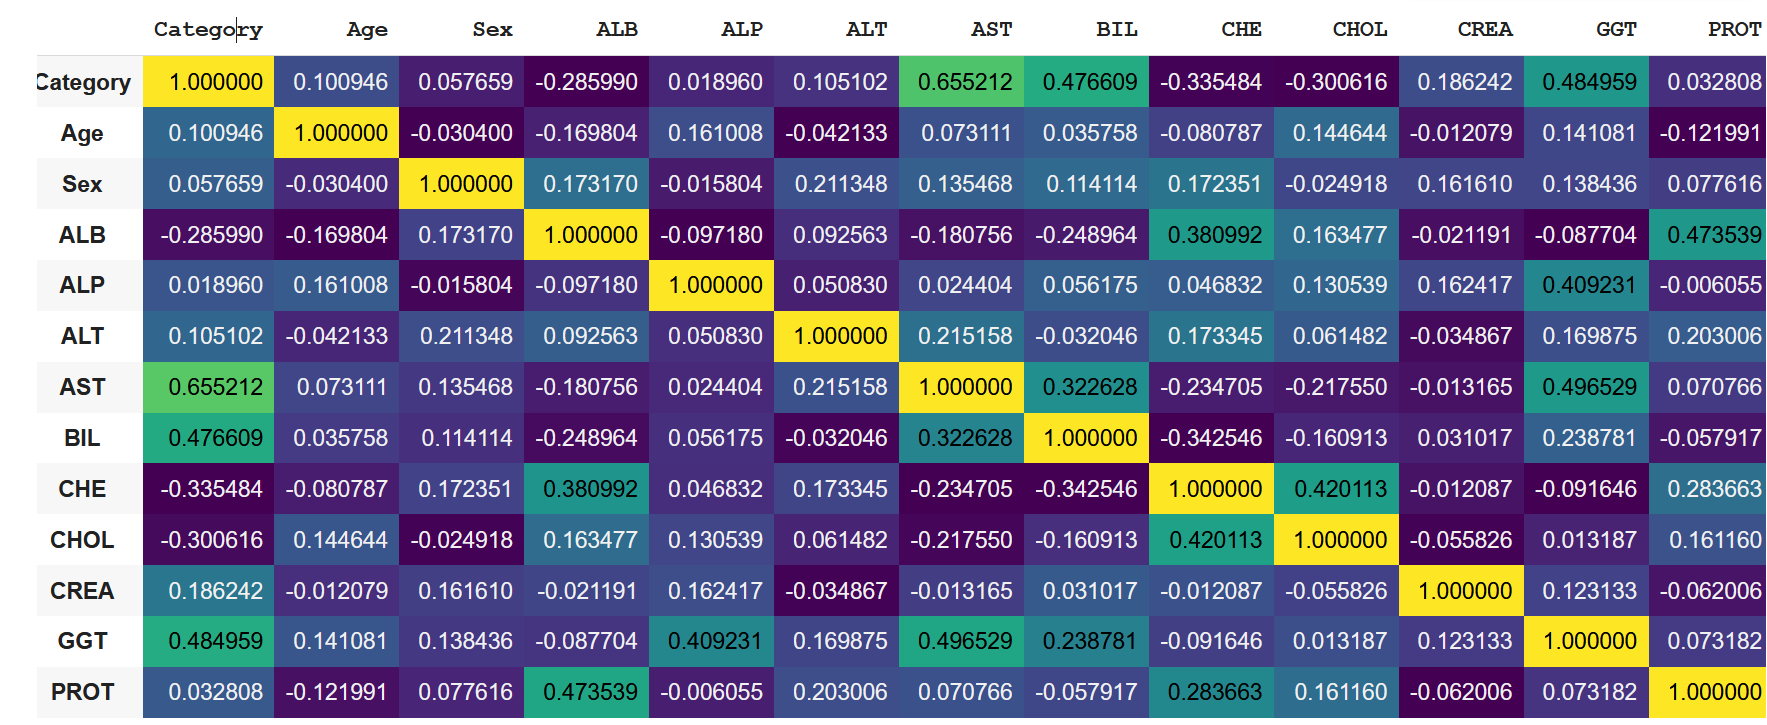
A quick look at the correlation coefficient matrix tells shows us that there are no reasons to be concerned about feature leakage. We also have no features like 'medication status', commonly affecting prediction outcomes in medical data sets.
To solve the problem of imbalanced data we can try over- and under-sampling strategies. I chose to use SMOTE - a synthetic minority over-sampling technique which increases the number of data points in minority classes, creating clones that slightly diverge from one another. SMOTE balanced the minority classes increasing my data set from 601 to 2132 rows.
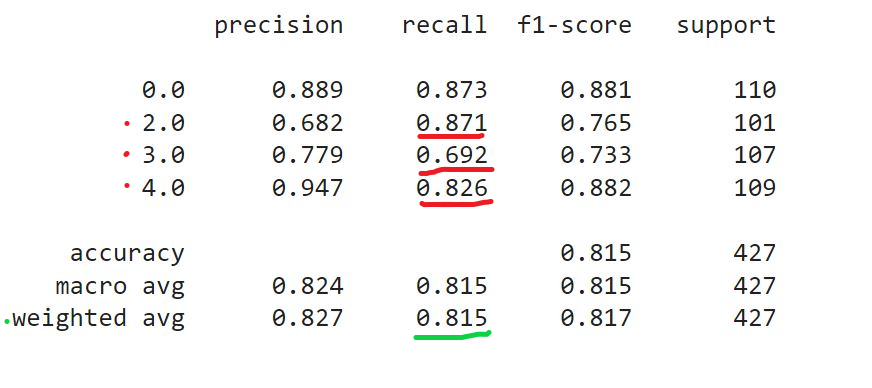
The key metrics I chose to evaluate the models is a weighted average recall. We want to make sure that none of the hepatitis cases flies under the radar and we are willing to sacrifice specificity to sensitivity. We can use sklearn classification report and recall score functions to obtain the recall values. Because this is a multi-class classification problem, our baseline weighted recall (accounting for 4 classes with equal relative frequencies) is 0.255. Our key objective is making sure that the highest proportion of actual positives is correctly classified. When building my models and tuning hyperparameters I was primarily looking at the recall values for classes 2, 3 and 4, which correspond to three stages of liver damage:
However, for practical considerations, when comparing the model performances, I had to use the weighted average recall, which can be returned through recall_score(average='weighted').
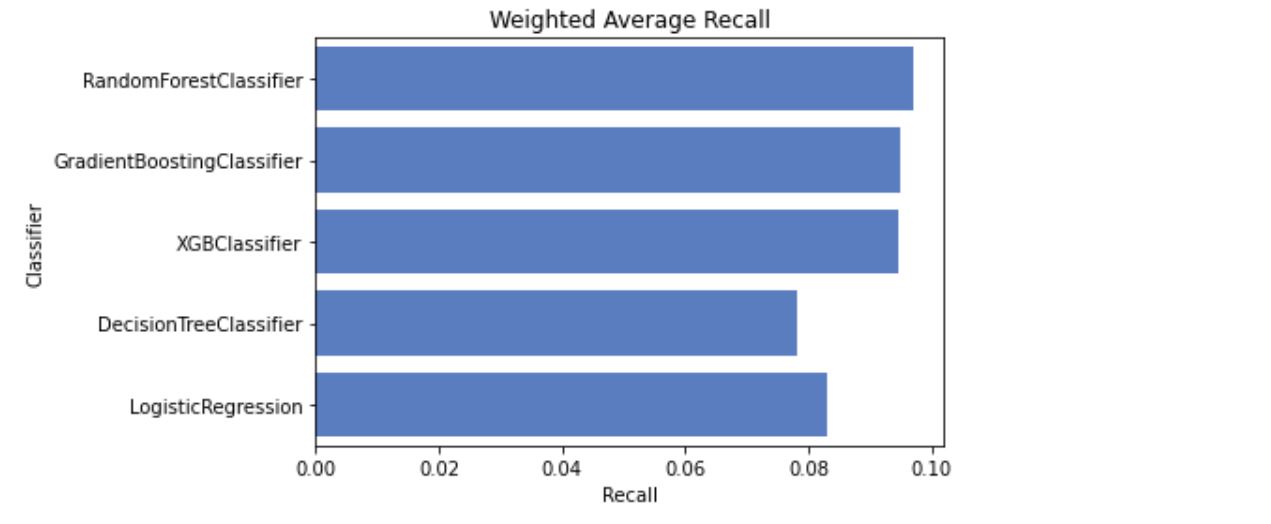
After splitting and scaling the data set I trained it on a number of models, which returned the following results:
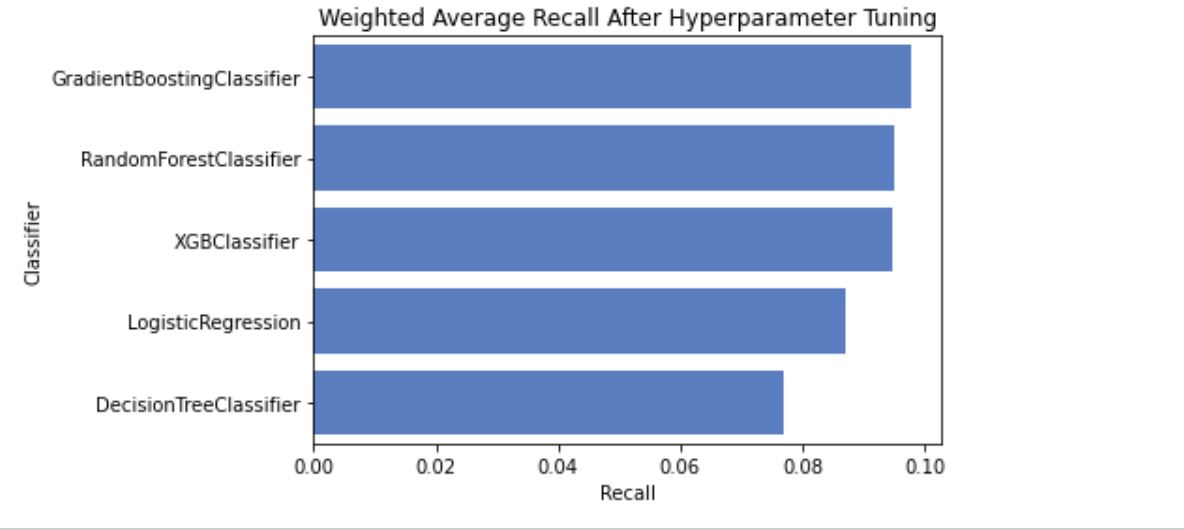
I tired tuning hyperparameters manually and with GridSearchCV. After hyperparameter tuning the performance of models increased slightly, with GradientBoostingClassifier taking the lead and showing best results overall, including accuracy and F1 score.
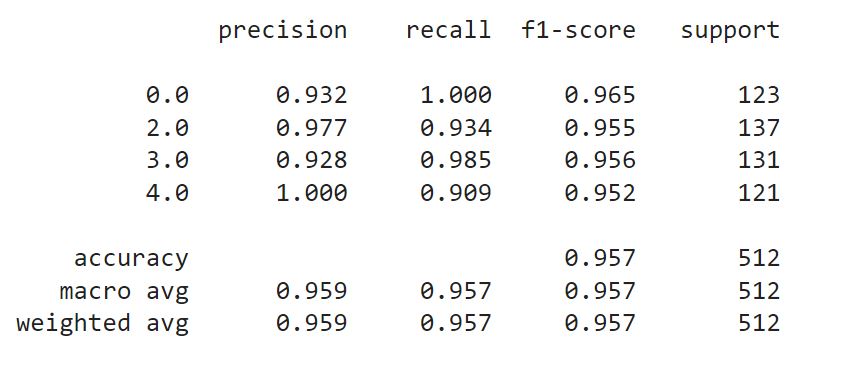
Naturally, I have selected the Gradient Boosting Classifier to try on my test set. The weighted average recall was somewhat higher than values I've got with my validation set (0.923 vs 0.957), however this overall increase was at the expense of individual recall values for the classes.
This concludes our project. The classifier rankings on F1 and accuracy scores presented identical picture with gradient boosting classifiers outperforming the rest. Naturally, after the first phase of diagnostics and identifying people with abnormal biomarker values, we would want to use different evaluation metrics, in particular to separate between damage classes more accurately. In this scenario, precision may be a more relevant measuring tool.