Polyphenols are a group of organic compounds widely available in fruits, vegetables and plant material. Many polyphenols have scientifically proven or purported health benefits that range from improved exercise recovery[1] to longer life spans[2].
In the Mediterranean diet, which has gained mainstream recognition[3] as an effective measure of reducing all-cause mortality, wine traditionally serves as one of the key sources of polyphenols, notably resveratrol. Resveratrol is a non-flavonoid polyphenol possessing two phenol rings connected by an ethylene bridge (that's ok, I'm not entirely sure what that means either). There are two isomers of resveratrol, cis- and trans-resveratrol, the latter believed to be more biologically active[4].
In recent years trans-resveratrol was widely popularized as a supplement, notably by work of Dr. David Sinclair, professor of genetics at Harvard Medical School, who in 2003 has discovered that isomer extends lifespan of yeast cultures by mimicking calorie restriction[5] . While at present there are no conclusive indications that trans-resveratrol longevity studies with yeast and mice are translatable to humans, they generally remain a good excuse to have a glass of wine.
It is well established that red wines contain much more resveratrol than white wines[4]. It is also sometimes assumed by wine drinkers[6], as well as doctors[7], that among red wines those with darker, more saturated color have higher resveratrol content.
The purpose of this project was to establish if there is a connection between the phenolic composition of red wines and their color palette. The wine dataset[8] used for the project was obtained from UCI Machine Learning Repository. The dataset contains 178 wine samples (instances) measured by 13 constituents:
           1)  Alcohol                              7) Flavanoids
           2)  Malic acid                           8) Nonflavanoid phenols
           3)  Ash                                  9) Proanthocyanins
           4)  Alcalinity of ash                    10) Color intensity
           5)  Magnesium                            11) Hue
           6)  Total phenols                        12) OD280/OD315 of diluted wines
                                                    13) Proline
The main limitation of the dataset is a limited number of cultivars (3) , all of which represent the same region of Italy. In addition the lingering variables, like the microclimate of the region, soil quality and local cultivation techniques could affect the outcomes. No dataset values were missing.

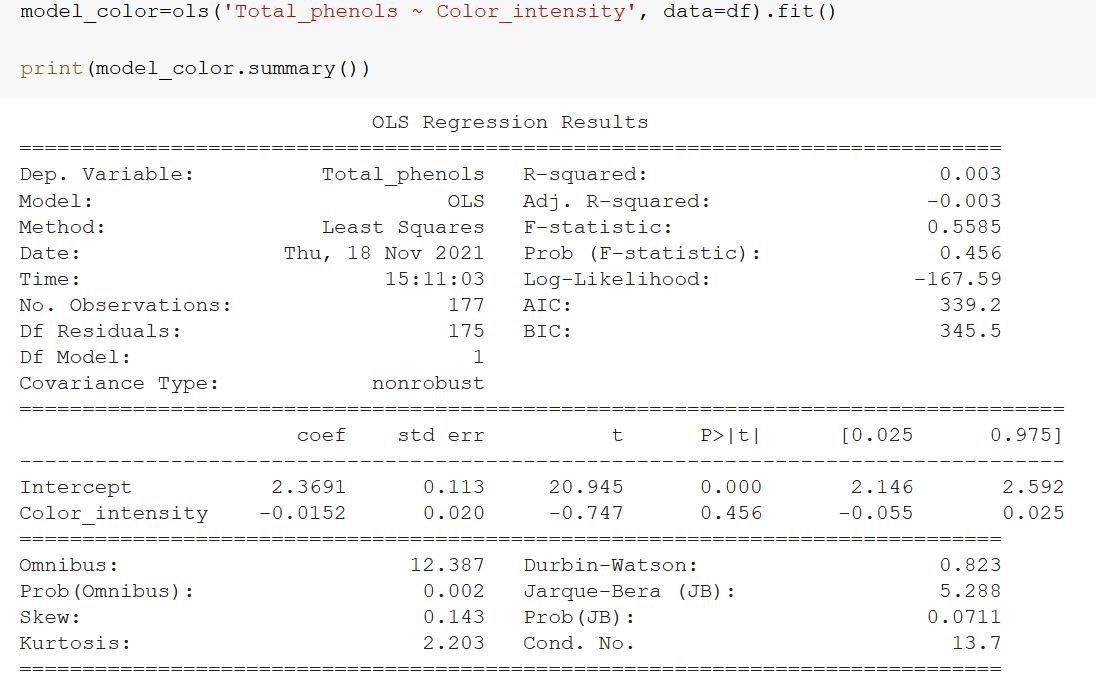
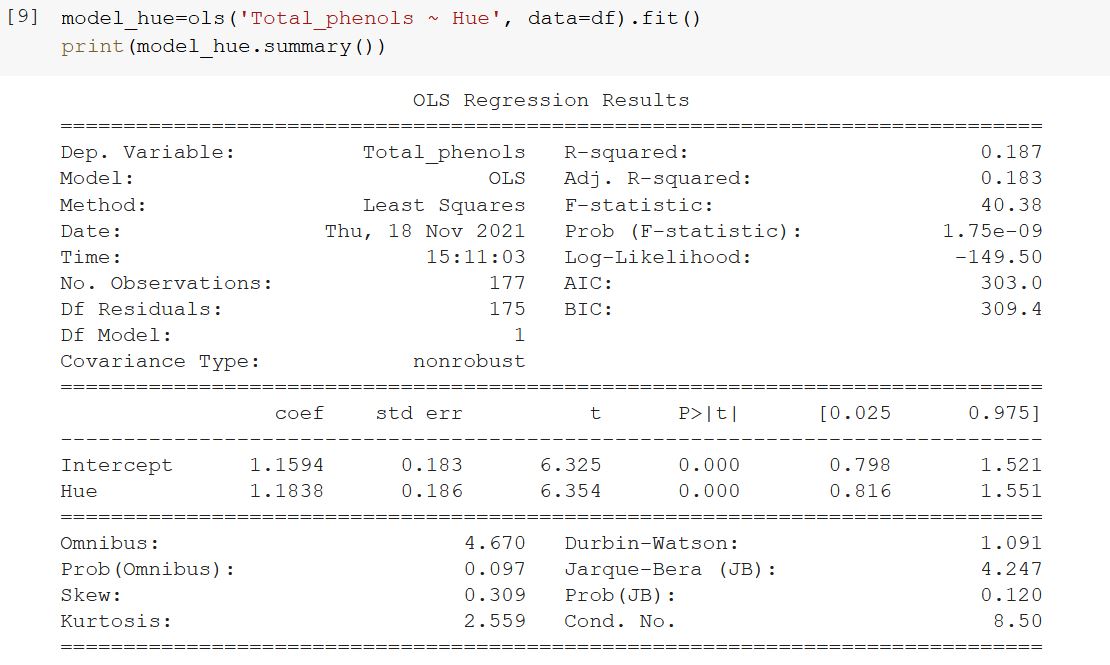
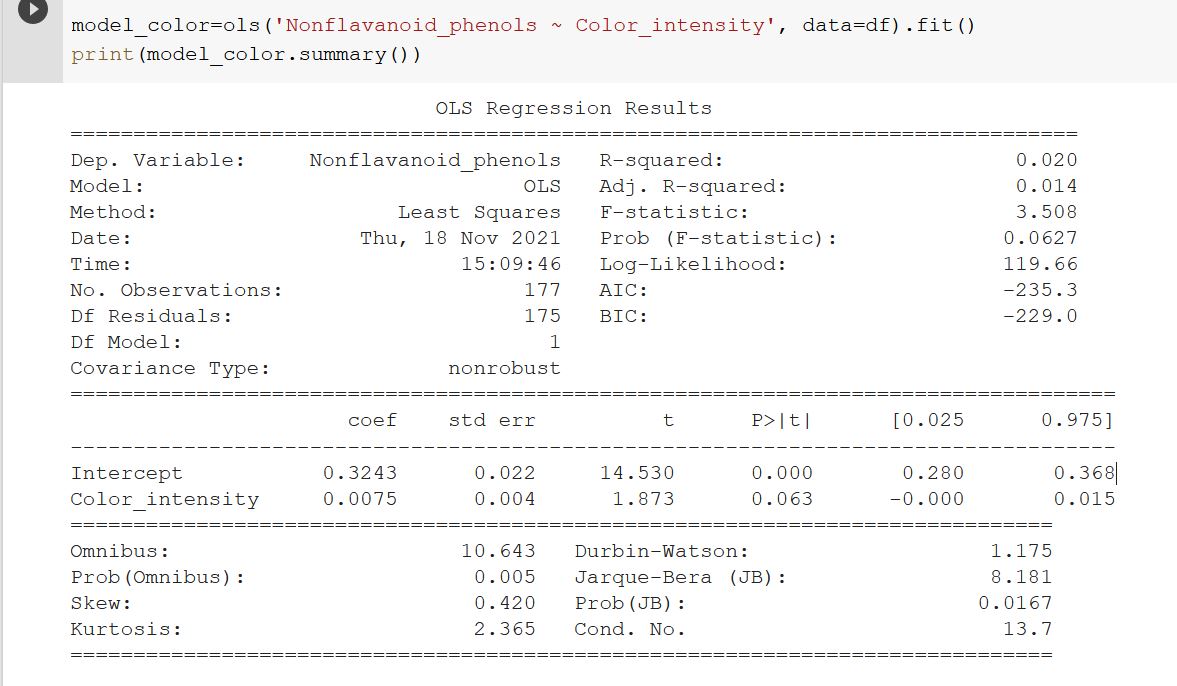
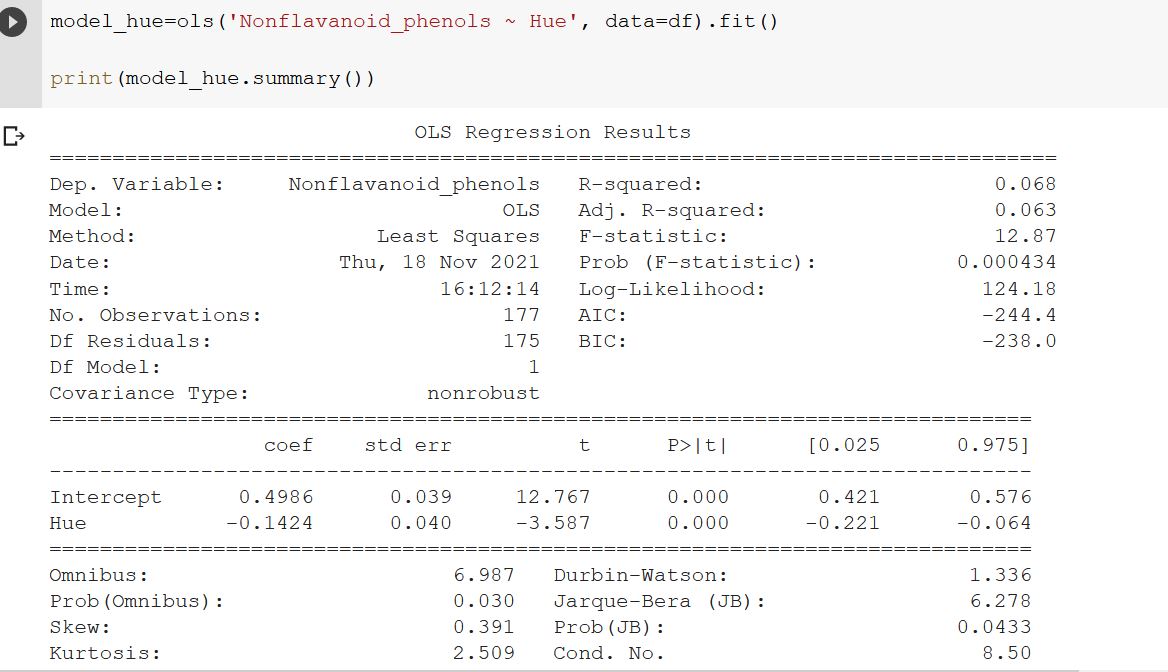
The observations on 6 (Total phenols) and 8 (Nonflavanoid phenols) were selected as target variables, 10 (Colour intensity) and 11 (Hue) were selected as predictors.
The correlation coefficients showed color intensity to be a weak predictor for both nonflavanoid phenols (0,14) and total phenols (-0.056).
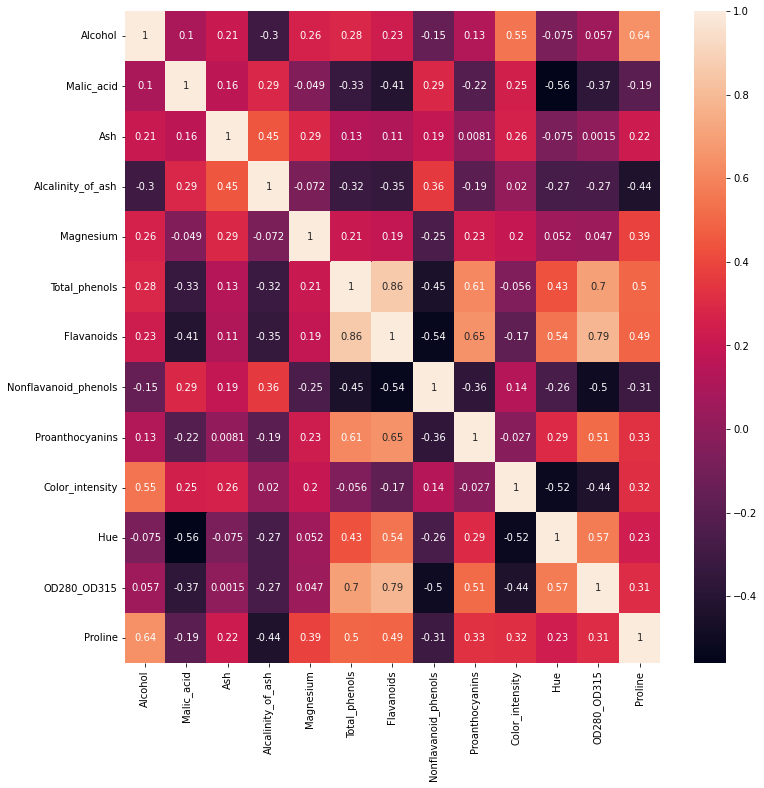
Hue, on the other hand, showed somewhat higher covariance with nonflavanoid phenols (-0.26) and total phenols (0.43). It is natural for wine to gradually change its color with ageing, undergoing a transition from red to warmer shades with more yellow in them. This transition can be measured in a lab[9] [10] and can be numerically expressed as a degree[11] (hue angle) ranging from 0 (red) to 90 (yellow). Alternatively, it can be expressed as a wavelength ratio of 420 nm (yellow) to 520 nm (red).
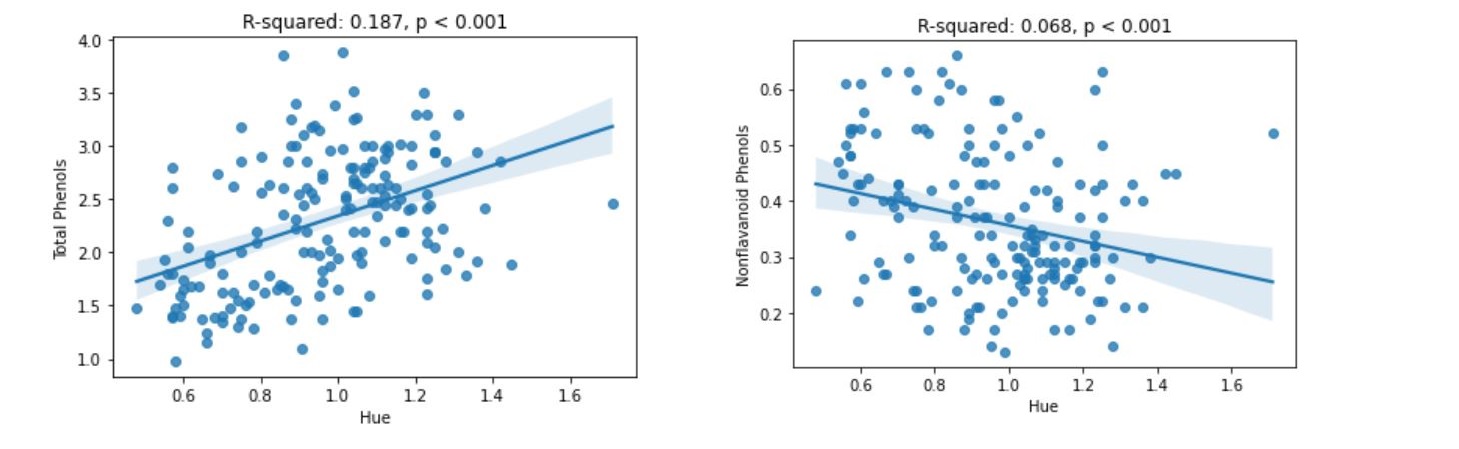
While there is a weak linear relationship between wine's hue and total phenol content (R-squared =0.187, p<0.001), the connection is far less apparent for hue and nonflavonoid phenols (R-squared =0.068, p<0.001), the constituent group which includes resveratrol. Only 19% of variability in total phenolic composition of wines can be explained by hue, while for nonflavonoid group, this number is closer to negligible 7%.
Since units of measurement for hue and color intensity were not explicitly specified in the dataset, the model selection is limited by feature scaling available to us. As a result, a simple linear regression model has been selected. It should be also noted that the model was not adjusted to account for outliers and large residuals. It is possible that removing influential outliers would markedly affect the resulting model.
Nonetheless, it appears from the dataset, that it is impossible to predict therapeutic qualities of wine attributable to resveratrol based on wine's color after all. You may enjoy red wines of any tone you like!
Linear Regression Models: